Evals: Four Numbers That Tell You Whether an AI System Actually Works
Evals split into inputs, system, grader and number, with the judge itself graded first. Every figure here is tagged with its source.
An eval spends most of its budget on reading outputs and labelling cases. Code is the cheap part. This piece splits the work into four parts and gives each part a number you can recompute.
The film runs one minute forty-four, voiced in English, with the captions burned in and switchable in the player.
1. Two green checks and an invented fifteen days#
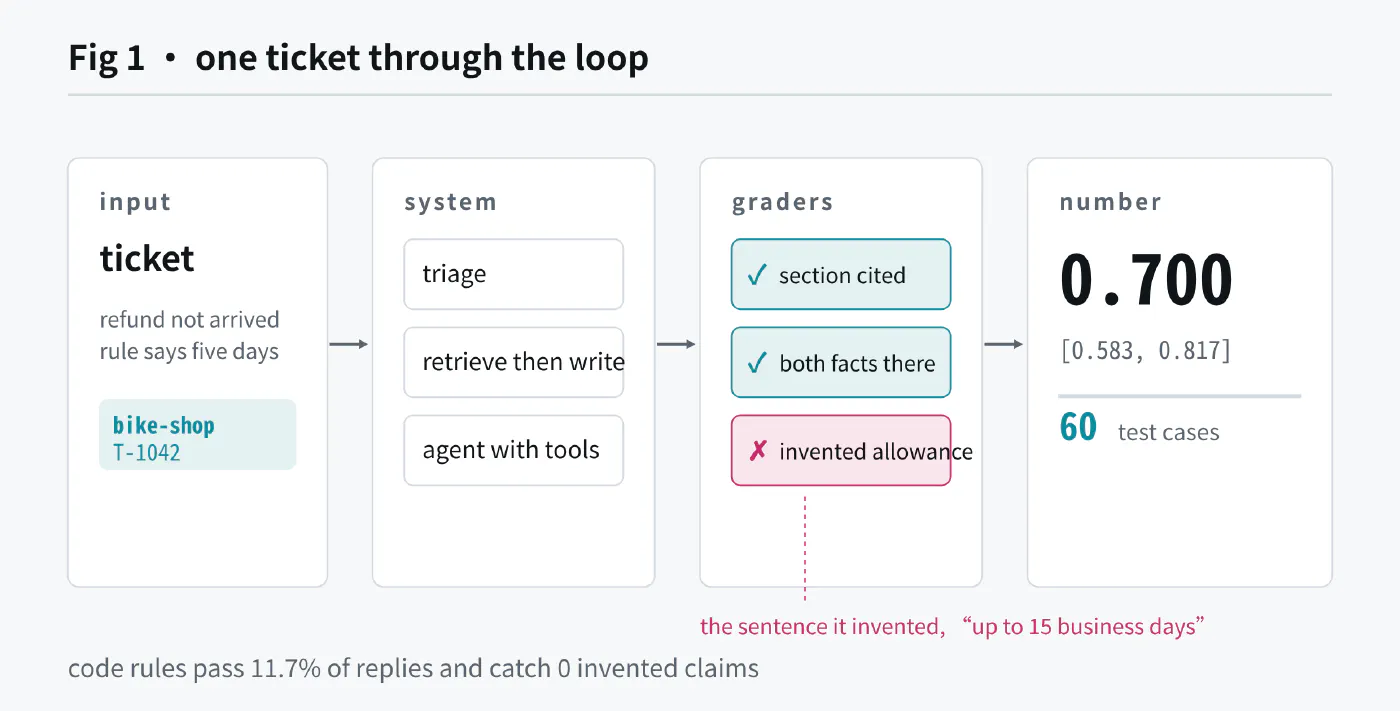
A shop selling bikes and camping gear routes support tickets to a model. One ticket says the bike came back last week, the refund has not arrived, and the customer quotes the shop’s own five-day rule back at it.
The reply is polite, runs four paragraphs, cites the returns section, and carries both required facts, the five business days and the 15% restocking fee on used items. Two code graders pass it at once. One checks that a section is cited, the other that the required facts are present.
A model judge fails it. The reply adds a sentence about a total allowance of up to 15 business days.
The author reran the loop over 60 test tickets. Only 11.7% of replies pass every code check, and the code checks caught none of the invented claims. Those two numbers side by side are the reason evals exist. A reply can be formatted correctly, cite the right section and still be wrong in the part the customer will act on.
2. Four words, four roads#
| Term | Measures | Example | Usual misuse |
|---|---|---|---|
| eval | your system on your data | this assistant on 60 tickets | comparing your model with someone else’s |
| benchmark | one model on a public task set | GSM8K, SWE-bench | choosing a product direction from it |
| test | does a function return the expected value | JSON parses, nothing crashes | reading a pass as correctness |
| monitoring | live traffic after launch | sampling tickets and grading them daily | looking only after an incident |
What separates them is ownership of the data. A benchmark’s questions were written by someone else. An eval’s cases are ones you collected, and if you have not collected any, you have no eval. The source article offers a figure worth keeping. The benchmark measures the engine, the eval measures the car on your road. The same figure explains why a model that tops a leaderboard can still get your customers’ questions wrong, with no contradiction involved.
3. Read the outputs before you write a grader#
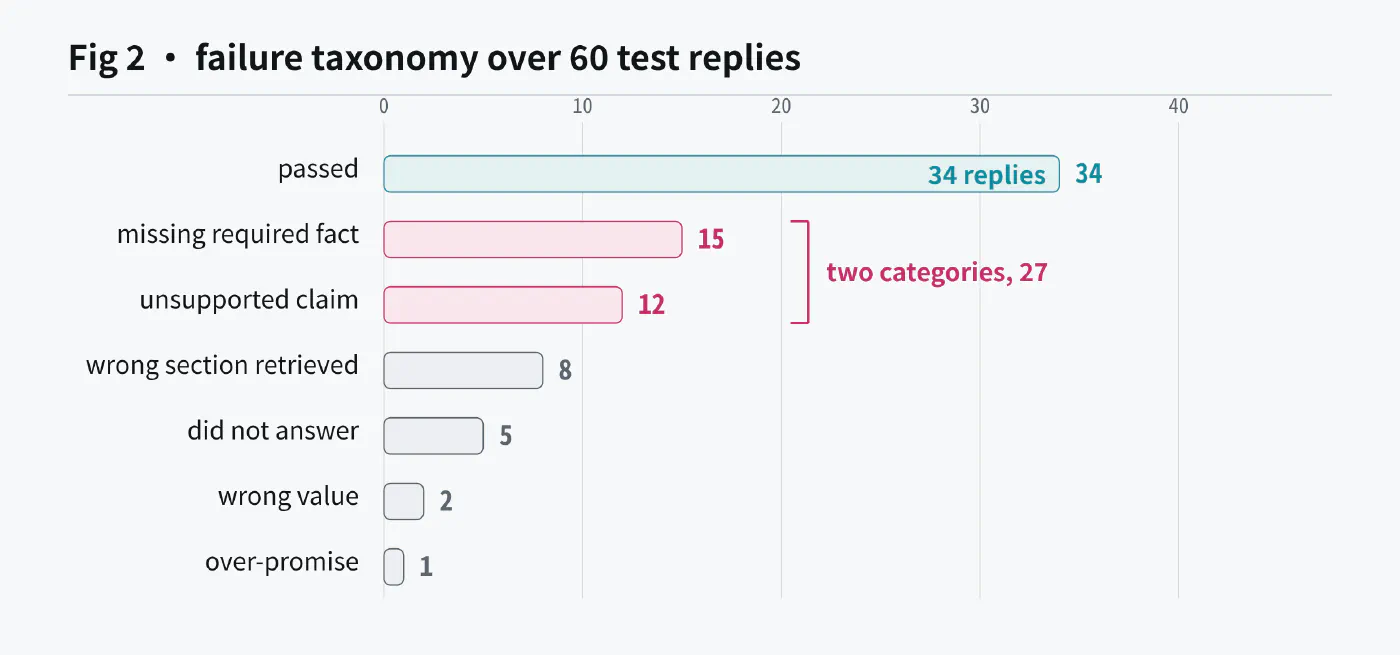
Read the outputs first. The author read 60 test replies, wrote one line on each failure, then merged the notes into categories. The count came out like this.
| Outcome | Tickets |
|---|---|
| passed | 34 |
| missing required fact | 15 |
| unsupported claim | 12 |
| wrong section retrieved | 8 |
| did not answer | 5 |
| wrong value | 2 |
| over-promise | 1 |
34 of 60 pass, barely half. The two largest categories add up to 27, and a demo of one ticket would never have shown them. That table becomes the specification for every grader built afterwards, ordered by frequency. A grader written for a failure that does not happen produces a reassuring number and misses the ones that do.
The rubric moves while you grade. Shankar et al. (2024) call it criteria drift. At ticket 40 the standard applied to the first 20 looks too loose, and the first 20 get marked again. Two or three rounds of that is normal work rather than rework.
4. What a code grader can finish#
Anything with a definite answer goes to a rule. Rules are free, instant and repeatable.
Triage picks one of 12 categories, so it is scored on accuracy. The author’s run gives accuracy 0.700 and macro F1 0.697. The two numbers sitting close together means the mistakes are spread across categories instead of piling into one.
Free text still obeys hard rules. On the same batch the non-empty check passes 100%, the banned-promise check 92%, and a 150-word limit 17%. That last number says the product talks too much, and no judge was needed to find it.
Required-fact checks live here too, which catches the most frequent failure at zero cost.
Similarity is a different instrument. Embedding similarity separates good replies from bad ones at an AUC of 0.709, where 0.5 is a coin flip. It answers whether a version changed. It cannot answer whether the change was for the better, because a wrong reply written in the right words scores high.
| Grader | Answers | Cannot see |
|---|---|---|
| code rule | format, label, required fact, banned phrase | meaning |
| similarity | did the output change | whether it is correct |
| specialised detector | is this claim supported by the text | anything else |
| generative judge | any criterion a reader can apply | its own bias, needs calibration |
| human label | ground truth | speed, cost |
| online A/B | real business impact | slow, users at risk |
5. The judge gets tested first#
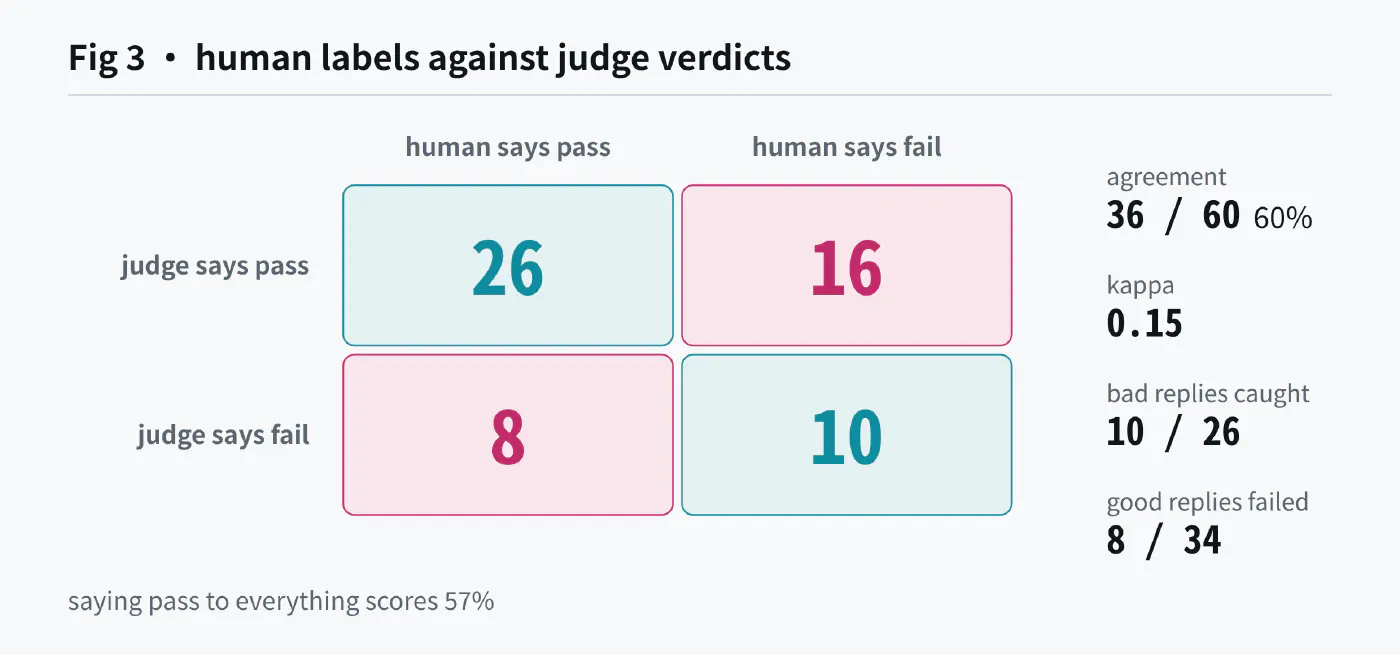
A human labelled all 60 replies as the reference. Then the judge ran.
| human says pass | human says fail | |
|---|---|---|
| judge says pass | 26 | 16 |
| judge says fail | 8 | 10 |
36 of 60 agree, which is 60%. The judge passes 42 replies, the human passes 34, and of the 26 bad replies the judge catches 10. Cohen’s kappa is 0.15.
Sixty percent sounds acceptable and is not. A judge that says pass to everything agrees 57% of the time on this batch, because most replies already pass. Kappa removes that floor. Zero is chance, one is perfect agreement, 0.6 is the usual bar for a judge allowed to gate a release and 0.8 for one left unsupervised. At 0.15 the judge is lenient and misses more than half the bad replies.
Kappa also moves with prevalence. The same judge on a batch where half the replies fail will score a friendlier kappa without any improvement in judgement. Report kappa, or report the caught bad replies and the wrongly failed good ones as two separate numbers. Reporting both is cheapest.
The biases are measured, and the fixes are cheap.
| Bias | What it looks like | Evidence | Fix |
|---|---|---|---|
| position | prefers whichever answer is shown first | swapping the order flips a large share of verdicts | grade both orders, count a win only when both agree |
| length | longer answers win | correcting for length raised agreement with humans from 0.94 to 0.98 | length-controlled scoring, or binary questions that do not reward length |
| self-preference | favours its own model family’s prose | same-family judges inflated their own agents by about 0.75 on a 7-point scale | use a judge from another family |
| satisfaction over success | rates how the conversation felt | a chat-only judge cannot separate working agents from broken ones, AUC 0.49 | give it the tool calls and the final state |
| judge identity | swapping the judge changes the winner | two 2026 audits | record the judge model and version next to every result |
Satisfaction deserves its own paragraph. GAUGE replays the release process most companies actually use. A simulated user talks to the agent, a judge reads the transcript and scores it, and the higher score ships. Across 25 agents and about 3,700 transcripts it ranks agents well when one is clearly stronger, at a correlation of 0.94 with a verifiable ground truth. On close pairs, the ones a release decision turns on, it promotes the worse agent 31% of the time. A judge that sees only the chat reaches an AUC of 0.49 and cannot tell a working agent from a broken one. Give it the tool calls, the authentication and the final task state and the AUC rises to 0.73, halving the failure risk. What the judge is shown decides its reliability. The model tier does not.
How the question is asked matters as much. Cho et al. (2026) replaced a single-score “rate this summary” with a set of yes/no questions such as “is this claim supported by the source” and raised agreement with humans from 0.514 to 0.563 on SummEval. They also planted three factual errors in one summary. The single-score judge gave it 5.0 out of 5, and the question-based judge scored it 1.57. Adding more instructions to the prompt eventually made the judge worse.
6. Numbers carry an interval#
Every percentage so far hides a question. Would another 60 tickets give the same number.
A bootstrap resamples the 60 results a few thousand times and looks at the spread. Triage accuracy is 0.700 with a 95% interval of 0.583 to 0.817. The honest sentence reads between 58% and 82%, most likely 70%. Writing 70% on its own throws the interval away.
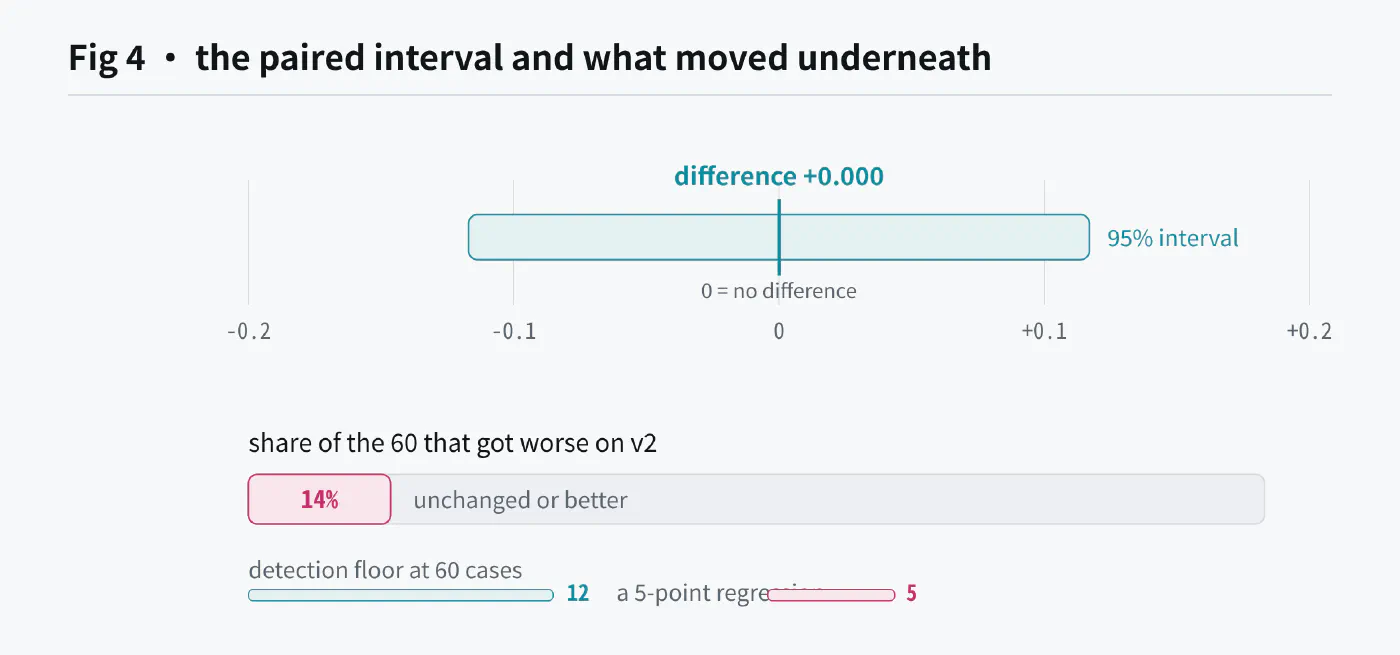
Comparing two versions uses pairs. The second reply prompt retrieves more sections, and both versions run on the same 60 tickets.
| Version | judge pass rate |
|---|---|
| v1 | 0.700 |
| v2 | 0.700 |
| difference | +0.000, 95% interval −0.117 to +0.117 |
The interval crosses zero, so the verdict is no difference and v1 stays. This interval is narrower than the single-version one because pairing cancels the difficulty of each ticket. McNemar asks the per-case question, whether v2 wins where v1 loses. Here the two versions traded cases. v2 regressed on 14% of tickets and improved on others. The total is unchanged while some customers got a better product and some got a worse one.
The detection floor can be computed. Sixty cases can reliably show a difference of about 12 percentage points, which makes a 5-point regression invisible at this size. That belongs in the weekly report. Below the floor, write that the run could not tell, not that the change helped a little.
Run 20 prompt variants and pick the best, and one of them will look 10 points better by luck. Correct for the number of comparisons or confirm the winner on fresh cases.
7. Systems with parts get graded in parts#
The support assistant has three parts, triage, retrieval plus writing, and an agent that acts. They fail differently and are fixed differently, so they are scored separately.
Retrieval first. hit@2 is 0.93 and recall@2 is 0.88. Of 18 failing replies, one failed in retrieval and 17 failed in the writer. That single line saves a week of work, because the reflex is to tune retrieval.
The writer is scored with the RAGAS triad, which needs no gold answers. The author’s run gives context relevance 0.855 and faithfulness 0.737, the same story the hand-written graders told, retrieval good and writing worse. Two independent instruments agreeing is what makes the number believable.
Agents need three changes. Grade the final state and the path, since an agent sometimes reaches a correct end state by a strange route. Run each task several times, where pass@k measures capability and pass^k measures reliability, and the customer-facing number is the second one, with the author’s agent at pass^3 = 0.75. Track cost separately, because the same task on the same model varies 30-fold between runs, accuracy peaks at intermediate cost and falls at the highest.
Reliability can also stand as its own axis. Rabanser et al. (2026) borrowed 12 metrics from aviation and nuclear engineering and grouped them into four families that run from consistency across runs to bounded harm. Across 15 frontier models, two years of capability gains bought about one sixth as much reliability. An agent that can do the work and an agent that does it right every time are different products, and the customer meets the second one.
One more thing gets missed. Once a judge is used to train or select a system, the system starts hunting for the judge’s blind spots. The Qwen team (2026) call this the verification horizon. Coding agents read the answer out of repository history, edit the tests, and patch for the evaluator. A behaviour monitor took hacked solutions from 28.6% to 0.6% and raised genuine ones from 40% to 61%. Keeping one judge the system never sees is the cheapest version of that defence.
8. A leaderboard picks an engine#
Public benchmarks narrow a shortlist. Four things to know first.
A score is a tuple of model, prompt, harness and version. The author ran GSM8K on one open-weight model with two prompt formats and got 0.686 and 0.746. The lm-evaluation-harness paper documents swings of double digits from prompt format, few-shot examples and the regex that extracts the answer.
Test items leak into training data. GSM1k rebuilt GSM8K with fresh questions of matched difficulty, and some model families dropped up to 8 points, with the size of the drop tracking how likely the model was to have memorised the original. Other families did not drop.
Benchmarks expire. A 2026 survey of 60 widely used benchmarks found about half saturated. SWE-bench Verified went from roughly 40% to over 80% in two years, and its curator says it no longer separates frontier models. On Chatbot Arena the top models now sit within about 20 Elo points, inside the noise.
The leaderboard is also redundant. Zeng and Papailiopoulos (2026) assembled a matrix of 84 models by 133 benchmarks and found its rank is about two, with two factors explaining more than 90% of the variation. Five well-chosen benchmarks predict the other 128 to within about 4 points. That is enough to pick an engine. It says nothing about a specific failure mode, which needs your own eval.
9. Four numbers, once a week#
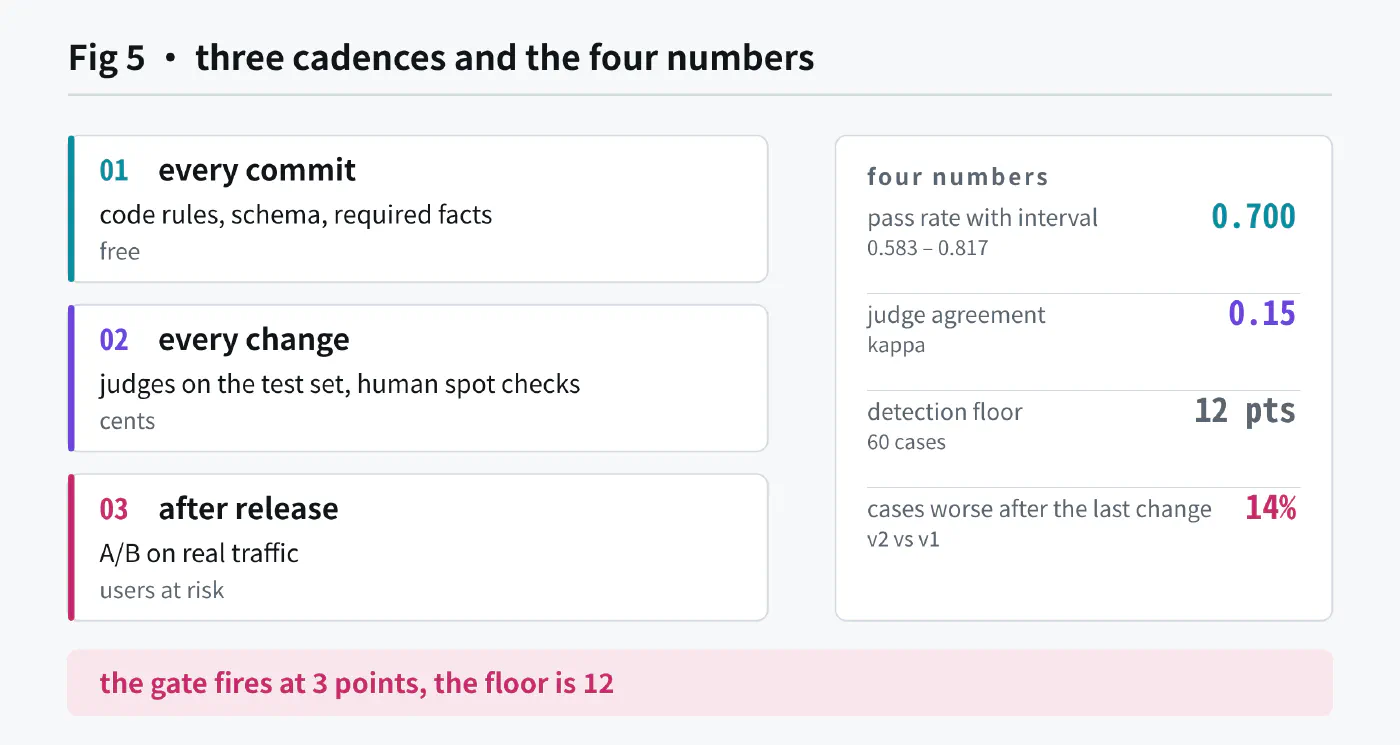
Habit costs less than expected. Hamel Husain’s three cadences carry over directly.
| Level | What runs | When | Cost |
|---|---|---|---|
| 1 | code rules, schema, required facts | every commit | free |
| 2 | judges and detectors on the test set, with human spot checks | every change to prompt, model or retrieval | cents |
| 3 | A/B on real traffic | after a release | users at risk |
The tutorial’s CI gate is the smallest usable version of this, failing the build when the pass rate drops more than 3 points below a recorded baseline of 0.70. It catches large holes. With a detection floor of 12 points, a 5-point regression walks straight through. The gate page should say so, or the gate gets read as a quality guarantee.
Caching takes the cost close to zero. A full A/B is 121 judge calls, about four cents, and a rerun with every call cached is zero calls. Cost is not the reason to skip evals.
One page carries four numbers.
| Number | Value on this batch | Source |
|---|---|---|
| product pass rate with interval | 0.700, 0.583 to 0.817 | tutorial, measured |
| judge agreement with humans | kappa 0.15 | tutorial, measured |
| detection floor | about 12 percentage points | computed from 60 cases |
| share of cases that got worse in the last change | 14% | tutorial, measured |
Missing any one of them makes the other three uninterpretable. The second is the one that gets skipped, and it decides whether the first can be believed.
References#
- Sergii Makarevych, 《Evals: how to know whether an AI system actually works》, X, 2026. https://x.com/sermakarevich/status/2106453816757354947
- Hamel Husain, 《Your AI Product Needs Evals》, 2024. https://hamel.dev/blog/posts/evals/
- Shankar et al., 《Who Validates the Validators?》, arXiv:2404.12272
- Miller, 《Adding Error Bars to Evals》, arXiv:2411.00640
- Bodhwani, Tran, Wei, 《GAUGE》, arXiv:2609.12191
- Cho et al., 《Ask, Don’t Judge》, arXiv:2606.27226
- Rabanser et al., 《Towards a Science of AI Agent Reliability》, arXiv:2602.16666
- Zeng, Papailiopoulos, 《You Don’t Need to Run Every Eval》, arXiv:2606.24020
- Wang et al., 《The Verification Horizon》, arXiv:2606.26300