The Ontology Divide Is Not Model Size
Six papers from late 2025 and 2026 point the same way. The bottleneck in ontology construction moved from who writes it to who can prove it is right, and every number here carries its source.
Between December 2025 and November 2026, six papers closed in on one conclusion from three directions. The bottleneck in ontology construction moved from who can write an ontology to who can prove the written thing is right. Every number below goes back to a named section or table.
Two minutes twenty-three, voiced in English, captions burned in and switchable in the player.
1. One incident, now measurable#
A team hands a 40-table relational schema to a model and gets an ontology back. Two days of review, a third of it rewritten, the rest signed off. Three months later somebody asks where one subclass relation came from, and nobody can say. It may have been derived from a foreign key. It may have been guessed from a neighbouring table name. After the fact the two are indistinguishable.
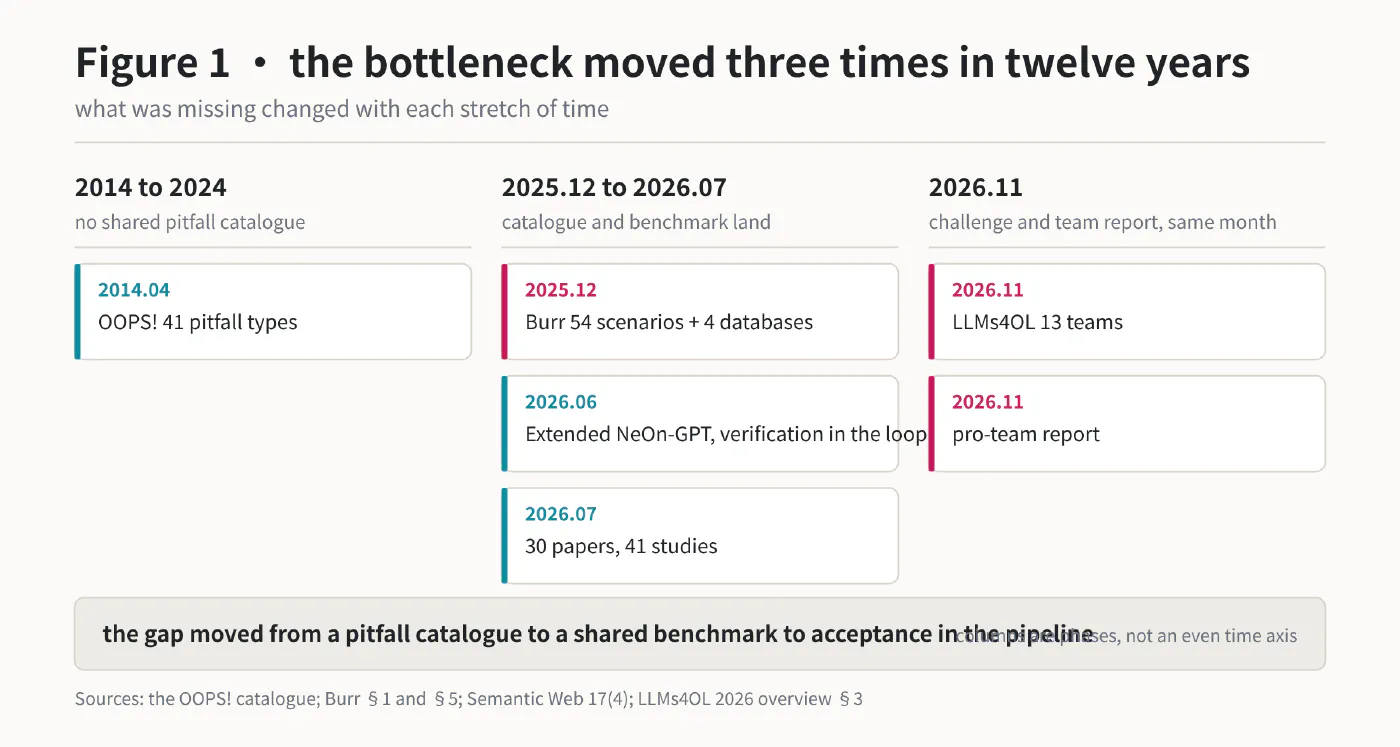
That story used to be an anecdote. In December 2025 Burr gave the field its first shared measure, 54 hand-built scenarios plus four real databases (PACMMOD 3(6), article 305). In July 2026 a systematic review finished counting the area, 30 papers and 41 studies (Semantic Web 17(4)). On 2 November 2026 the third LLMs4OL challenge published its overview with 13 scored teams. The three differ in scale and agree on the problem.
2. The first shared benchmark ends the “models win” story#
Burr settles an old debt in §1. The authors reviewed ten ontology learning systems following Mosca et al. and found that most papers do not evaluate their approach at all, or compare only lexically without saying how the F1 score is computed.
Their fix is to bind evaluation to mappings (§4). A class name alone earns nothing. The system has to say which table and column it corresponds to, and a true positive is counted on the mapping. That single change separates a name that looks right from a pointer that is right, and it exposes how much lexical F1 inflates.
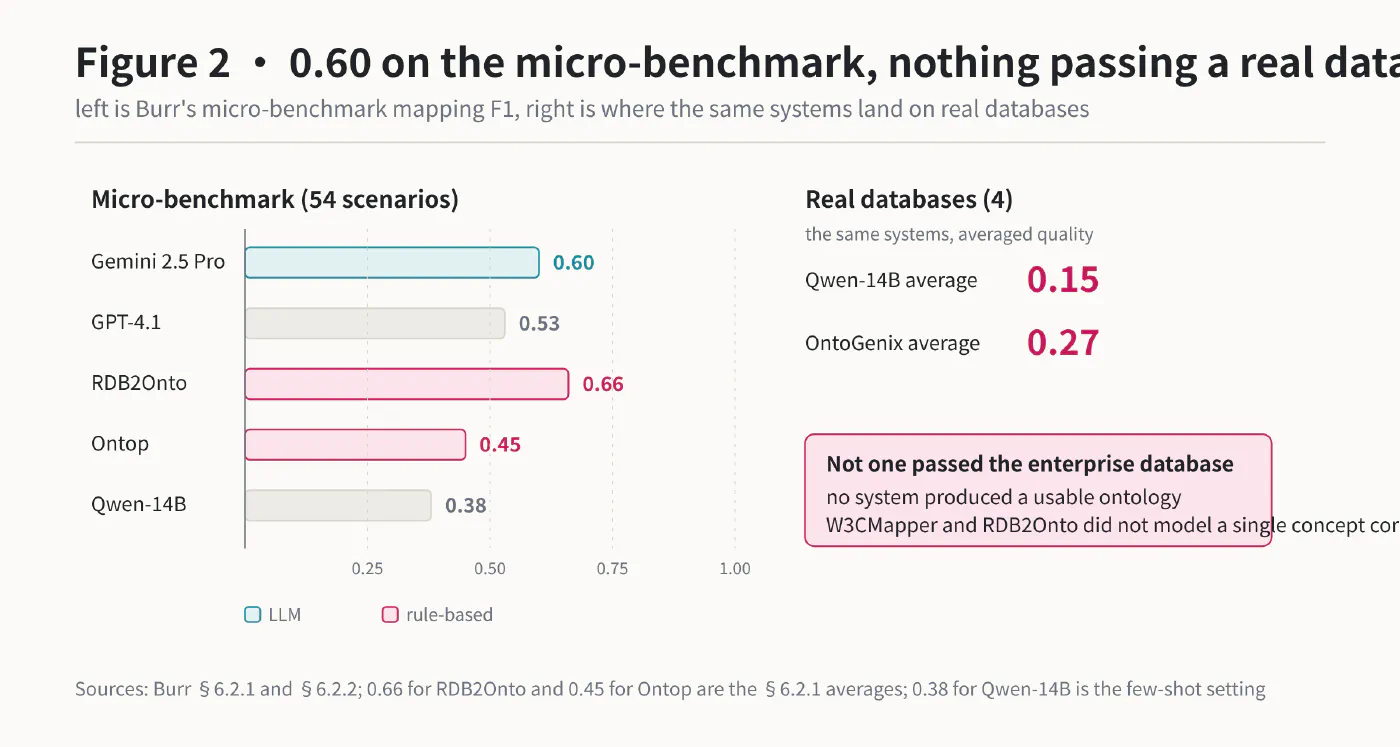
The micro-benchmark (§6.2.1) lands like this.
| System | Micro-benchmark mapping F1 | Note |
|---|---|---|
| Gemini 2.5 Pro, checklist prompt | 0.56, 0.60 with few-shot | best overall |
| GPT-4.1 | 0.53 | second |
| Qwen-14B | 0.00 to 0.38 | output barely parseable on a simple prompt, 0.38 once examples are supplied |
| RDB2Onto | 0.66 | rule-based, finer N-to-M handling |
| Ontop | 0.45 | rule-based |
| Special scenarios, every system | 0.61 | two simple scenarios combined is enough to hit the ceiling |
The real databases tell a different story (§6.2.2). The authors’ own words are that all systems perform poorly. Qwen-14B averages 0.15, OntoGenix 0.27. On the NPD database the rule-based systems beat every LLM. The enterprise database is larger and heavily denormalised, and no system produced a usable ontology on it at all. W3CMapper and RDB2Onto failed to model a single concept or relationship correctly.
The foreign-key numbers are more informative. Adding key constraints to Mondial lifts Ontop’s relationship score from 0.00 to 0.35 and RDB2Onto’s from 0.00 to 0.24. Gemini barely benefits, which the authors attribute to prompts growing longer with each constraint. Runtime splits widely too. Every system except OntoGenix finishes within 11 seconds, while OntoGenix needs up to 45 minutes because it calls the model repeatedly.
One correction is due here. Burr’s abstract stresses the strength of rule-based approaches, which reads like plain LLMs losing to rules, yet Gemini wins the micro-benchmark. The rule-based wins have conditions. Foreign keys have to be complete, the schema has to be normalised, and the conventions in the database have to match the rules. The accurate version is that rules hold up where structure is clear, LLMs do better where schemas are denormalised and meaning has to be inferred, and neither clears a real enterprise database. RIGOR later cites Burr as finding that LLM methods underperform rule-based systems on mapping recovery, which is the same simplification.
3. Thirty papers, one gap#
The systematic review by Li, Garijo and Poveda-Villalón sorts 30 papers into 41 studies by development phase.
| Phase | Studies | Note |
|---|---|---|
| Implementation (conceptualisation, encoding, matching, evaluation) | 27 | where nearly all work sits |
| Requirements (CQ generation, SPARQL formalisation) | 12 | second densest |
| Publication (documentation) | 4 | few |
| Maintenance | 1 | a single paper |
Of 41 studies, 11 ran no experiment, 9 ran no evaluation at all, and 3 of the 27 with experiments published no access link (§4.3). §5.3 states it plainly. These evaluations score whole pipelines rather than individual LLM components, so cross-paper comparison is rarely fair, and small changes in prompt design or corpus selection move results significantly.
The review’s recommendation is modular evaluation frameworks. Generation methods are no longer scarce. Comparable acceptance is.
4. Put the skeleton before the model#
RIGOR (arXiv 2506.01232v2) is the most complete engineering answer on this line in 2026. It walks tables in foreign-key order and does four things per table (§3.1 and the abstract). It first emits a deterministic direct mapping so schema coverage never depends on the model. It then retrieves context from three places, the table’s schema and documentation, the core ontology built so far, and external domain ontologies. A Gen-LLM enriches the fragment with provenance annotations. An independent Judge-LLM validates it and corrects what fails.
On defects, measured with OOPS! and its 41 pitfall types (§4.6), the eICU-CRD database produces 665 pitfalls from direct mapping, every baseline exceeds 400, and RIGOR drops to single digits, with 26 for the DeepSeek variant. All three RIGOR variants reach zero pitfalls on Chinook. It is also the only method to emit owl:disjointWith axioms, 13 of them on Chinook with Mistral, where no other method produced any.
It also settles Burr’s account. On Burr’s ISWC database RIGOR reaches class F1 0.73, relation F1 0.67 and attribute F1 0.52. §4.7 says in as many words that RIGOR reverses this finding, and the reversal comes from model generation plus schema-grounded provenance, not from a larger model.
Ten experts in ontology engineering and knowledge representation add a second reading. RIGOR ranks first in 28 of 40 evaluations, 70 percent, with Kendall’s W between 0.39 and 0.72 (§4.7). The ablation in §4.8 shows every one of the three retrieval sources matters. Documentation alone gives the best documentation F1 and the worst overall alignment.
5. Axioms are the ceiling#
If ontology construction has a ceiling, it sits at the axiom layer. OntoAxiom (arXiv 2512.05594) runs 12 models, three shot settings and two prompting strategies across nine mid-sized ontologies holding 17,118 triples and 2,771 axioms.
| Axiom type | Mean F1 (Table 5) |
|---|---|
| subclass | 0.359 |
| subproperty | 0.106 |
| disjoint | 0.095 |
| domain | 0.038 |
| range | 0.030 |
Prompting is not the main variable. Axiom-by-Axiom peaks at 0.130, Direct at 0.126 (Table 7). §6 concludes that performance is constrained by task difficulty rather than prompt design. Domain matters far more, with FOAF reaching 0.642 on subclass and the music ontology 0.218. Domain and range axioms come last because their meaning shifts with context, and the same property can have different domains in different fields.
The preprint carries one internal inconsistency worth noting. §5.4 says o1 scores F1 0.164, while Table 9 on the same page reports 0.197. The gap is small, but it is exactly the problem the review describes. A number that disagrees with its own table cannot be reproduced.
6. The label space decides the score#
The LLMs4OL 2026 overview (OCP volume 11, published 2 November 2026) puts three tasks side by side and states its conclusion in the first line of the abstract. Constraining the label space through a supplied vocabulary matters more than model scale.
Flagship builds an ontology from raw text, and its 11 teams span graph similarity 0.4167 to 0.7762. Every team rises monotonically from exact to semantic matching, a gap of 0.13 to 0.19, which means a large share of predictions are lexical or paraphrastic variants rather than outright errors. Task-oriented F1 is much lower, 0.4903 at best. Reuse supplies a partial ontology and a candidate vocabulary, and 5 of 8 teams clear 0.85, with term typing at 0.9989.
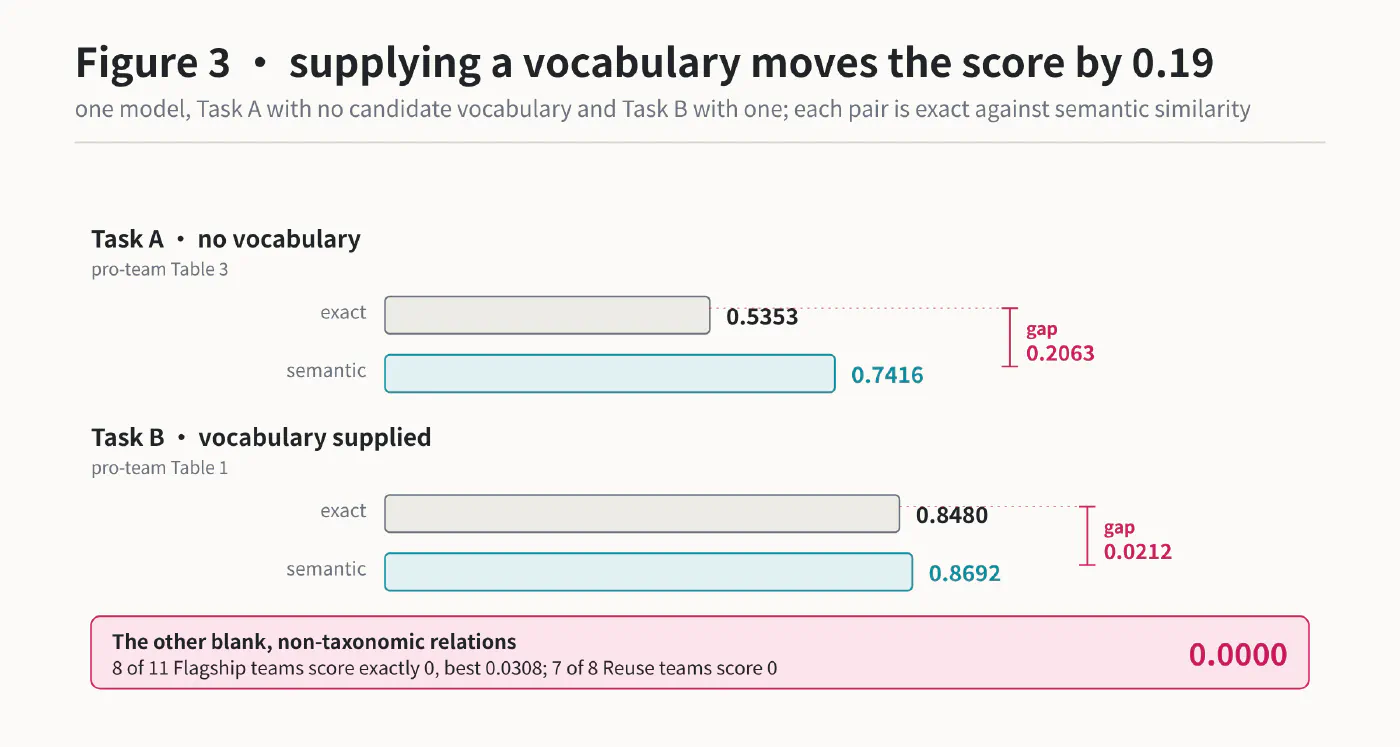
Non-taxonomic relations are a different matter. Eight of 11 Flagship teams score exactly 0.0000 and the best reaches 0.0308. In Reuse, 7 of 8 score 0.0000 and the single non-zero entry is 0.1818.
The pro-team report measures the same effect a second way. One Qwen2.5-14B plus retrieval pipeline reaches exact 0.8480 and semantic 0.8692 on Task B, where the vocabulary is constrained, a gap of 0.0212. On Task A, with no closed set to constrain against, it reaches 0.5353 exact and 0.7416 semantic, a gap of 0.2063 that the authors call a 20-point difference.
| Task | Exact graph similarity | Semantic graph similarity | Gap | Source |
|---|---|---|---|---|
| Task B, vocabulary supplied | 0.8480 | 0.8692 | 0.0212 | pro-team Table 1 |
| Task A, no vocabulary | 0.5353 | 0.7416 | 0.2063 | pro-team Table 3 |
Same team, same model, and the distance between the two tasks is not comprehension. It is whether a vocabulary was handed over. The vocabulary is chosen by people, and the model is told to use it.
7. The checklist is already an engineering artifact#
Follow those threads and acceptance turns out not to lack tools.
OOPS! has been keeping a pitfall catalogue since 2014 and now lists 41 entries, P01 through P41, each graded critical, important or minor (the live catalogue was revised in April 2023). RIGOR uses it as one of its evaluation strategies and drops eICU from 665 pitfalls to single digits, so the two ends connect.
Extended NeOn-GPT (Semantic Web 17(4), 2026-06-26) moves verification into the pipeline. A multi-step draft is followed by orchestrated calls to third-party tools, then LLM-suggested repairs, and an explicit ontology reuse step. It covers four domains with four proprietary and open models, and most entity and triple similarities land between 0.5 and 0.8.
Industry supplies its own signal. At QDB'25, BNDES audited 400 production schemas and 10 TB of data with small language models, and the generated analysis scripts contributed to resolving 58.7 percent of the reported issues. Data governance and modelling are converging on the same object, which is the schema itself.
The requirement side has an anchor too. OE-Assist assembled 1,393 competency questions with their ontologies and stories across 33 domains. A competency question is the closest thing this field has to an acceptance test, because it asks whether the ontology can answer a question that has one right answer.
8. Where we sit, and four holes#
Our own approach is 32 acceptance rules, chosen by walking OOPS! and its 41 pitfall types one by one, with the acceptance standard fixed before generation starts. That is a design decision and not a measurement, so there is no score to report here. It occupies the part of the line above that is thinnest, writing the acceptance first and letting the model submit to it.
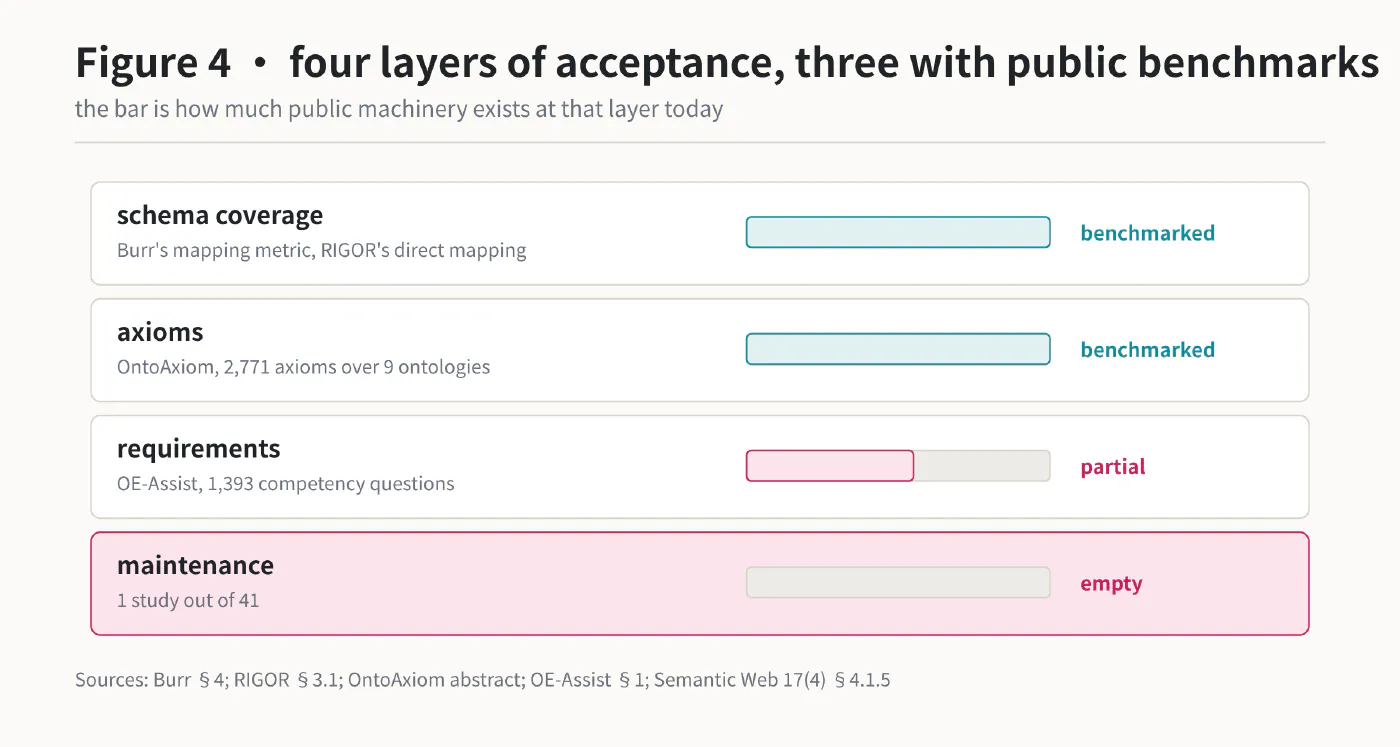
Figure 4 splits acceptance into four layers and marks which ones have a public benchmark. Schema coverage has Burr and RIGOR, the axiom layer has OntoAxiom, requirements have a competency question set, and maintenance has essentially nothing.
Four holes remain, ordered by the strength of the evidence.
Non-taxonomic relations sit near zero across both tasks, 0.0308 at best. Domain and range axioms score 0.030 to 0.038. Maintenance appears in one study out of 41. Lexical fidelity shows up as the 0.13 to 0.19 distance between exact and semantic scoring, which says models often know the meaning and still write the wrong token, while downstream alignment needs the URI.
9. Why now, and how to check it yourself#
Industry arrived before the papers did. Gartner published three notes on 26 August, 2 September and 6 November 2026 about agents lacking trustworthy context, about a minimum viable ontology, and about how eleven enterprises are operationalising ontology governance (documents 8304653, 8340117, 8609137). All three are abstract pages with no published method or data, so they answer why now and say nothing about what is correct.
The papers can be checked directly. These five take a minute or two each.
| What to check | Where | What to look at |
|---|---|---|
| The micro-benchmark and real-database gap | Burr §6.2.1 and §6.2.2 | 0.60 and all systems perform poorly in one paper |
| How the pitfall count fell | RIGOR §4.7 | 665 against single digits |
| How low the axiom layer goes | OntoAxiom Table 5 | domain 0.038, range 0.030 |
| Text disagreeing with its own table | OntoAxiom §5.4 and Table 9 | 0.164 and 0.197 |
| What a vocabulary buys | LLMs4OL 2026 Table 2 | the exact column across Task A and Reuse |
The field has changed its hard problem three times in twelve years. A pitfall catalogue was missing first, and OOPS! supplied it. A shared benchmark was missing next, and Burr supplied it. What is missing now is acceptance inside the pipeline, and no paper can do that part for you because it depends on how your own data is defined.
References#
- Laskowski, Hladik, Portisch, Panse, Naumann. 《Burr, a Benchmark for Ontology Learning from Relational Databases》. PACMMOD 3(6), 2025. https://doi.org/10.1145/3769770
- Li, Garijo, Poveda-Villalón. 《Large Language Models for Ontology Engineering, a Systematic Literature Review》. Semantic Web 17(4), 2026. https://doi.org/10.1177/22104968261465514
- Fathallah, Nayyeri, Yogi, Thapa, Tautenhahn, Schnurpel, Staab. 《RIGOR, Retrieval-Augmented Generation of Ontologies from Relational Databases》. arXiv 2506.01232v2. https://arxiv.org/abs/2506.01232
- Bakker, Di Scala, de Boer, Raaijmakers. 《Ontology Learning with LLMs, a Benchmark Study on Axiom Identification》. arXiv 2512.05594. https://arxiv.org/abs/2512.05594
- Babaei Giglou, Auer, D’Souza. 《LLMs4OL 2026 Overview》. OCP 11, 2026. https://doi.org/10.52825/ocp.v11i.3728
- Mishra, Meena, Ojha, Singh, Singh. 《pro-team at LLMs4OL 2026 Tasks Flagship and Reuse》. OCP 11, 2026. https://doi.org/10.52825/ocp.v11i.3663
- Fathallah et al. 《Extended NeOn-GPT》. Semantic Web 17(4), 2026. https://doi.org/10.1177/22104968261453138
- Poveda-Villalón, Gómez-Pérez, Suárez-Figueroa. 《OOPS!, the OntOlogy Pitfall Scanner》. IJSWIS 10(2), 2014. https://doi.org/10.4018/IJSWIS.2014040102
- Seabra, Cavalcante, Ruberg, Lifschitz. 《Towards an SLM-based Auditing of Relational Schemas and Data Quality》. QDB'25 at VLDB 2025. https://www.vldb.org/2025/Workshops/VLDB-Workshops-2025/QDB/QDB25_7.pdf
- Lippolis et al. 《OE-Assist》. arXiv 2507.14552. https://arxiv.org/abs/2507.14552
- Gartner. 《Build and Govern Ontologies to Ground Trustworthy AI Agents》, 2026-09-02. https://www.gartner.com/en/documents/8340117
- Gartner. 《How to Enable the Context Layer With a Minimum Viable Ontology》, 2026-08-26. https://www.gartner.com/en/documents/8304653
- Gartner. 《Consult the Board, Establishing and Operationalizing Enterprise Ontologies》, 2026-11-06. https://www.gartner.com/en/documents/8609137